Quantitative analysis of NYSE/NASDAQ stocks
Quantitative analysis, based on real data, starts for the next trading week usually every Thursday after market closing time.If the system works, here the results of the weekly (Friday-Thursday) quantitative analysis and neural network prediction of the selected NYSE/NASDAQ stocks.
The quantitative analysis is based on day by day data.
Please read the DISCLAIMER. I am not providing professional investing advice. You are responsible for any investment decisions you make using this website and I do not guarantee that they are error-free.

Stock price evolution of stocks
(first table below)Based on:
- risk free rate (based on current three-month U.S. treasury bill) of last days( Please evaluate the values of the "Estimated_Gain" with utmost caution! Without guarantee! )
- past volatility of the stock
- last closed price of the stock
- (this is a daytrading system, the dividend does not play a role here)
(Click the table header to sort data according to that column.)
Quantiative analysis of stocks
(second and third table below)Caption
Configuration of the ARIMA-EGARCH (A_) model:Reference value: close price with EMA-12
ARIMA(p,d,q): p = best choice out of 1..3; d = 1; q = best choice out of 1..3
EGARCH(p,q): p = best choice out of 1..3; q = best choice out of 1..3
exo. input: S&P 500 Index
More configuration information about ARIMA-EGARCH model on demand.
Configuration of the NEURAL NETWORK (N_) model:
Reference value: log. returns
More configuration information about NN model on demand.
Sym = symbol at the stock exchange
Nr = number in my stock symbol list
Date = last data date of the stock
Price = last price at the end of the day in USD
A_MSE_Tr = ARIMA-EGARCH mean squared error of autoregressive integrated moving average model on train data (decimal)
A_MAPE_Tr = ARIMA-EGARCH mean absolute percentage error of autoregressive integrated moving average model on train data (decimal)
A_HR_Tr = ARIMA-EGARCH hit rate of autoregressive integrated moving average model on train data (decimal)
A_MSE_Te = ARIMA-EGARCH mean squared error of autoregressive integrated moving average model on test data (decimal)
A_MAPE_Te = ARIMA-EGARCH mean absolute percentage error of autoregressive integrated moving average model on test data (decimal)
A_HR_Te = ARIMA-EGARCH hit rate of autoregressive integrated moving average model on test data (decimal)
N_MSE_Tr = NEURAL NETWORK mean squared error of train data (neural network) (decimal)
N_MAPE_Tr = NEURAL NETWORK mean absolute percentage error of train data (neural network) (decimal)
N_HR_Tr = NEURAL NETWORK hit rate of train data (neural network) (decimal)
N_MSE_Te = NEURAL NETWORK mean squared error of test data (neural network) (decimal)
N_MAPE_Te = NEURAL NETWORK mean absolute percentage error of test data (neural network) (decimal)
N_HR_Te = NEURAL NETWORK hit rate of test data (neural network) (decimal)
N_MSP = NEURAL NETWORK multistep performance (next days: 5)
N_DEV = NEURAL NETWORK mean deviation of predicted vs. reached log. returns in % (last days: 5)
VaR = Value at Risk
Min = minimal step (if forecasted price => price step, if forecasted log. returns => log. return step). For a better comparability log. returns are representative. This regards following financial ratios!
Max = maximal step
Mean = mean step at observation time frame (see Obs, 1 Obs = 1 passed tradeday)
Std = standard deviation
Skew = skewness
Kurt = kurtosis
Obs = observation
CCI (momentum) = Commodity Channel Index (days: 20, const.: 0.015)
RSI (momentum) = Relative Strength Index (days: 14)
WILLR (momentum) = Williams %R (days: 5)
EMA (trend) = Exponential Moving Average (days: 10)
MACD (trend) = Moving Average Convergence Divergence (short: 12 days, long: 26 days, signal: 9 days)
ADX (trend) = Wilder's DMI (days: 14)
OBV (volume) = On Balance Volume
CMF (volume) = Chaikin Money Flow (days: 10)
MFI (volume) = Money Flow Index (days: 10)
ATR (volatility) = Average True Range (days: 20)
VR (volatility) = Volatility Ratio (days: 14)
HHLL (volatility) = Highest High, Lowest Low (days: 20)
LONG_Sig (signal) = long signal (1 = potential to buy)
SHORT_Sig (signal) = shot signal (1 = potential to buy)
QA_Score (score) = my own score based on choiced indicators (on demand)
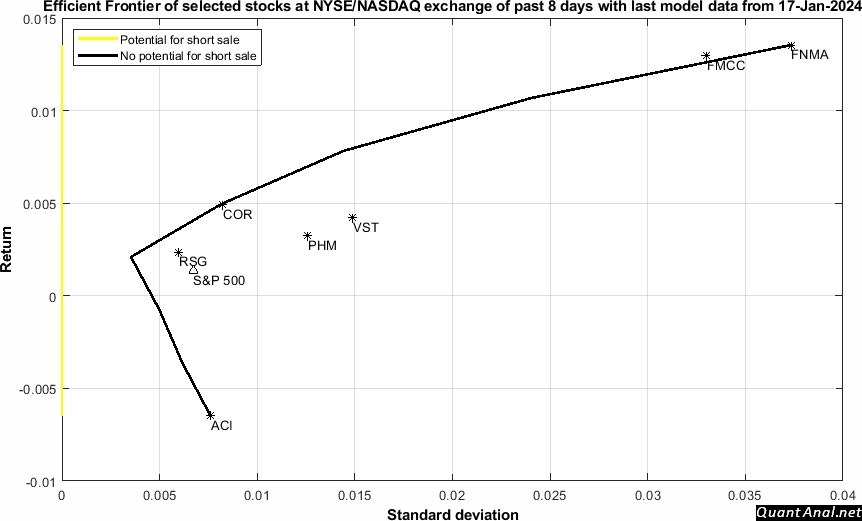
MA_Choice (score) = markowitz choice (efficient frontier), decimal percentage of possible portfolio, e.g. 0.23 = 23% of whole portfolio
(Click the table header to sort data according to that column.)